Superinteressante Magazine
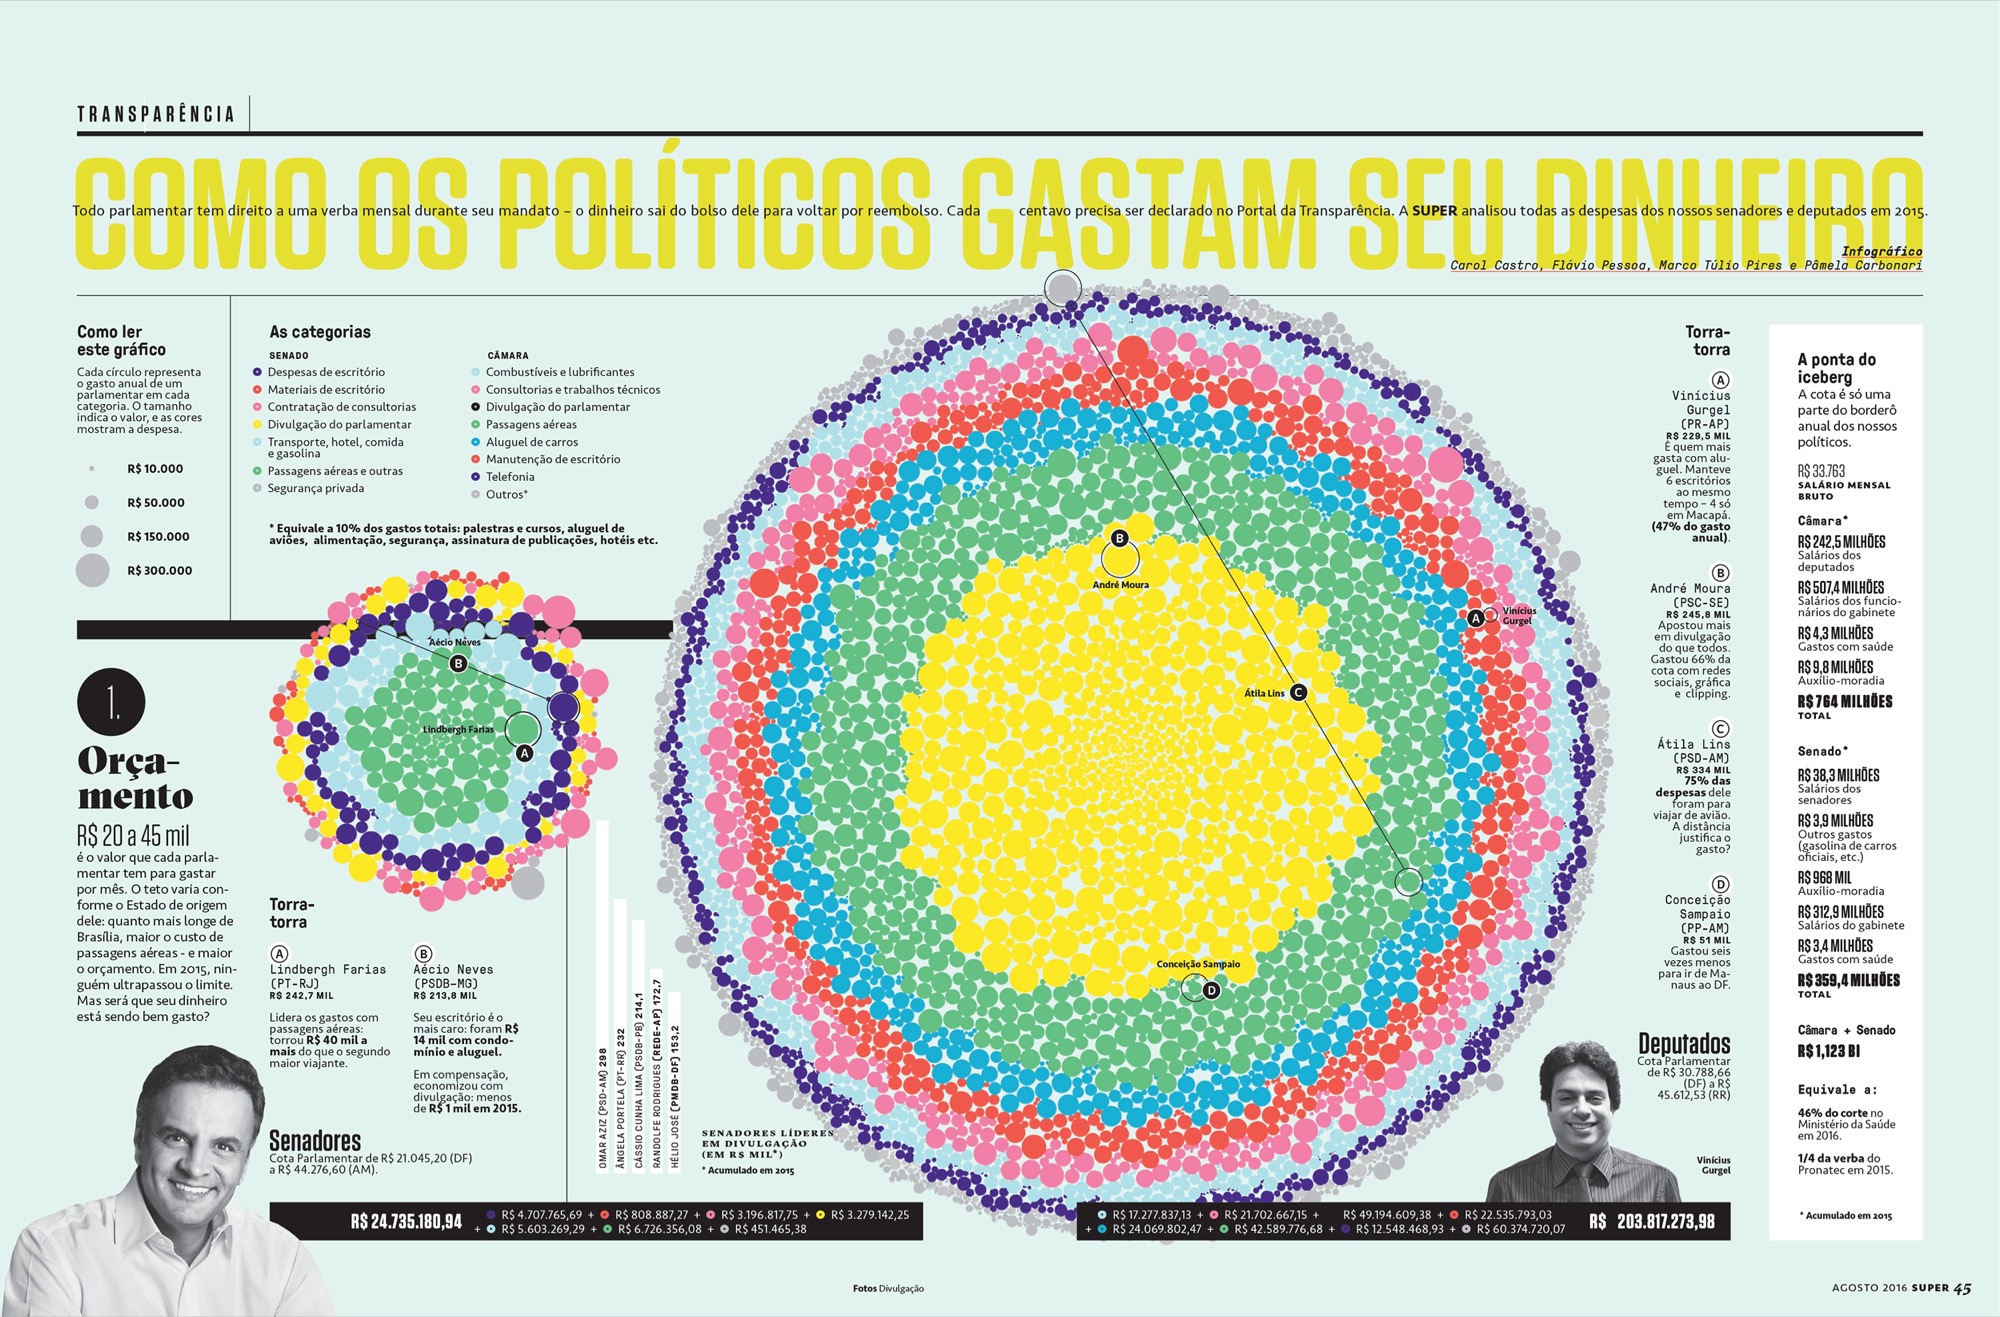
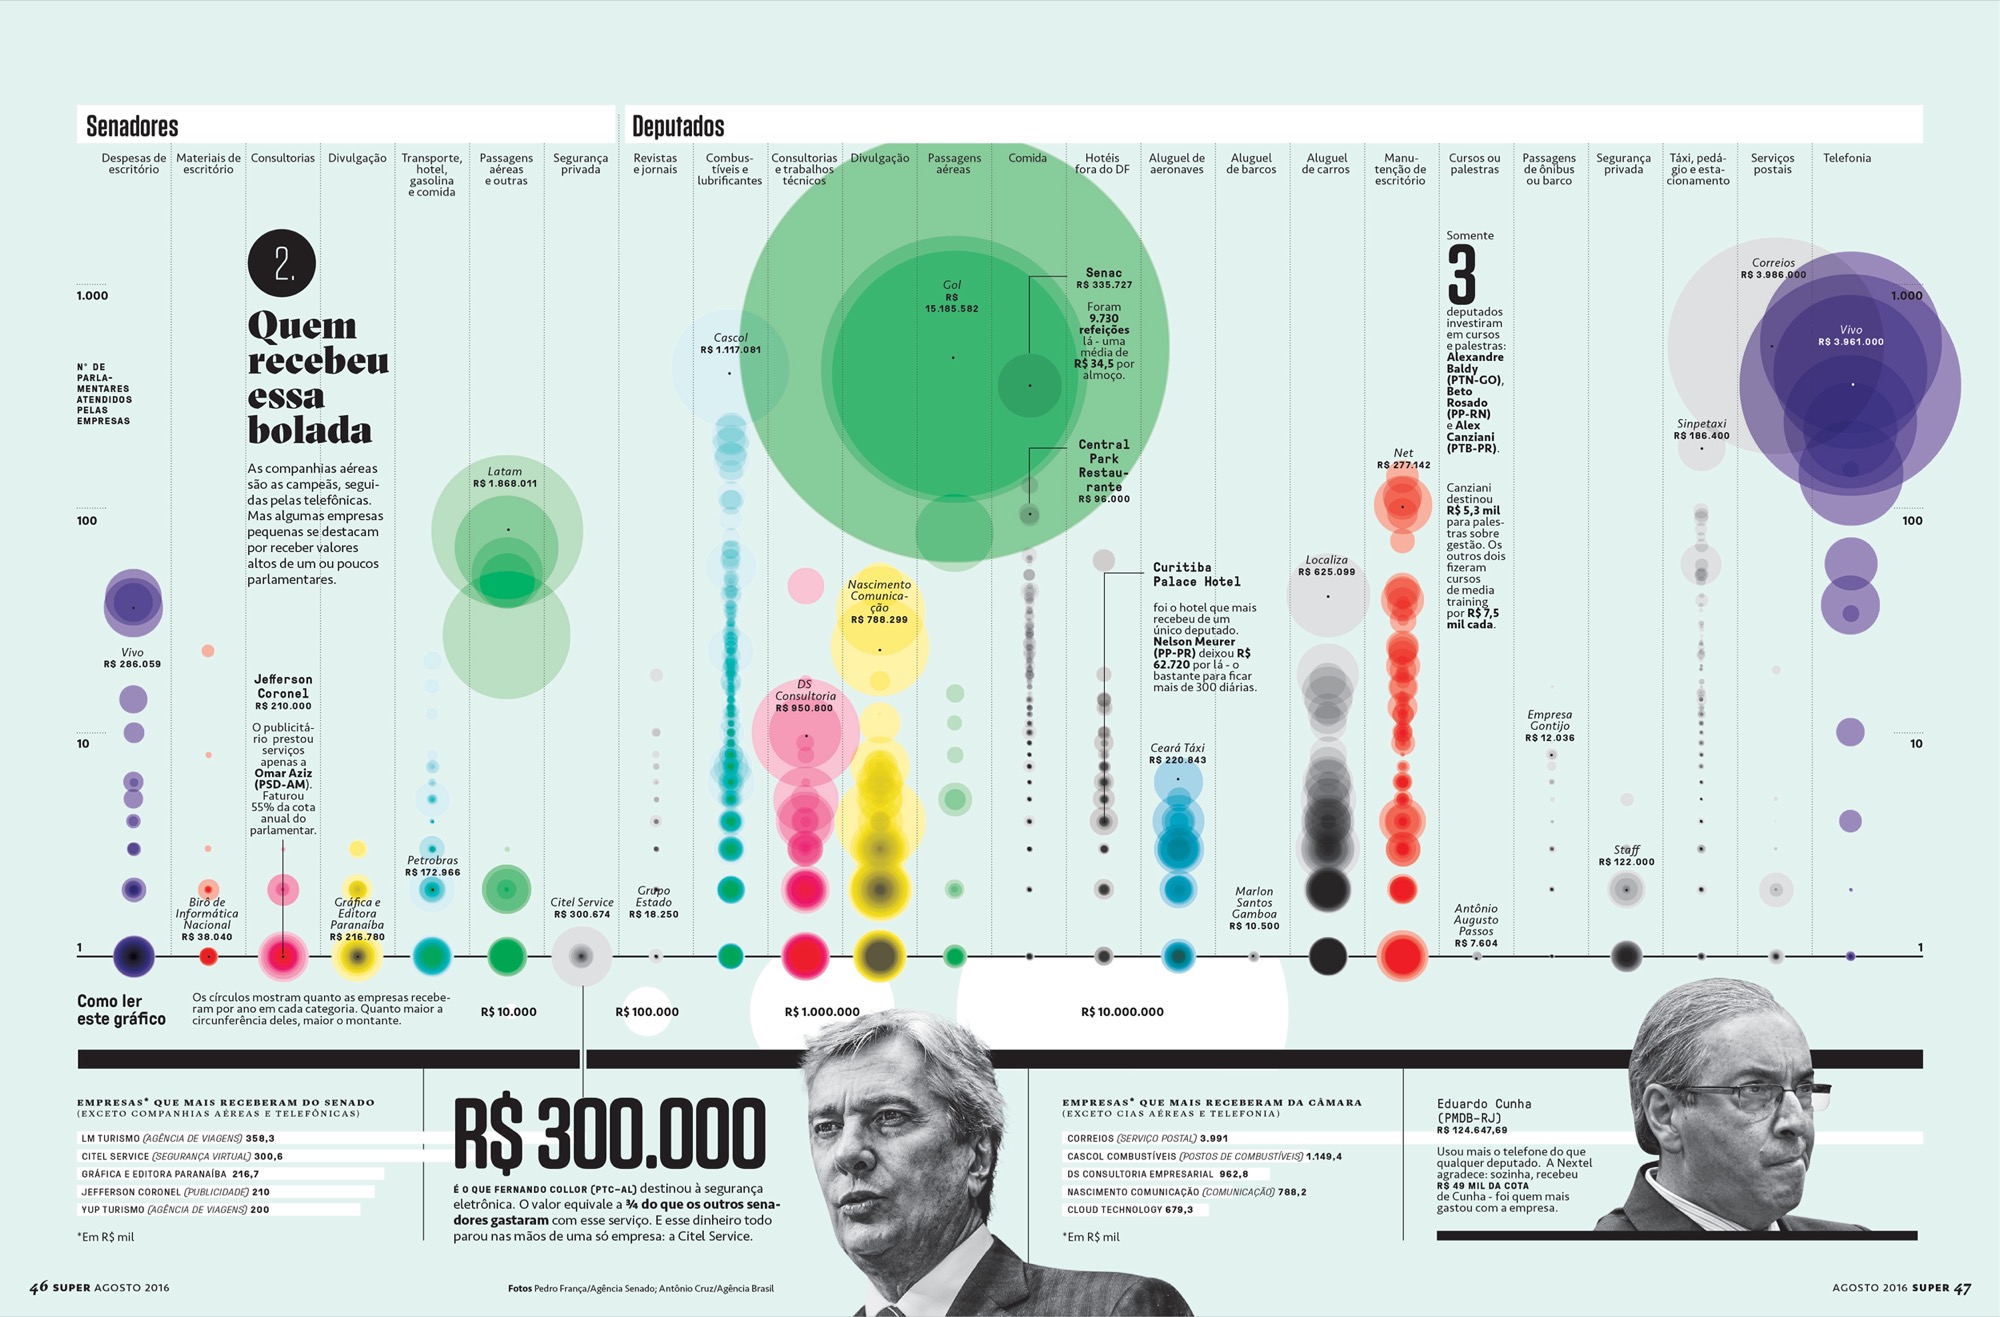
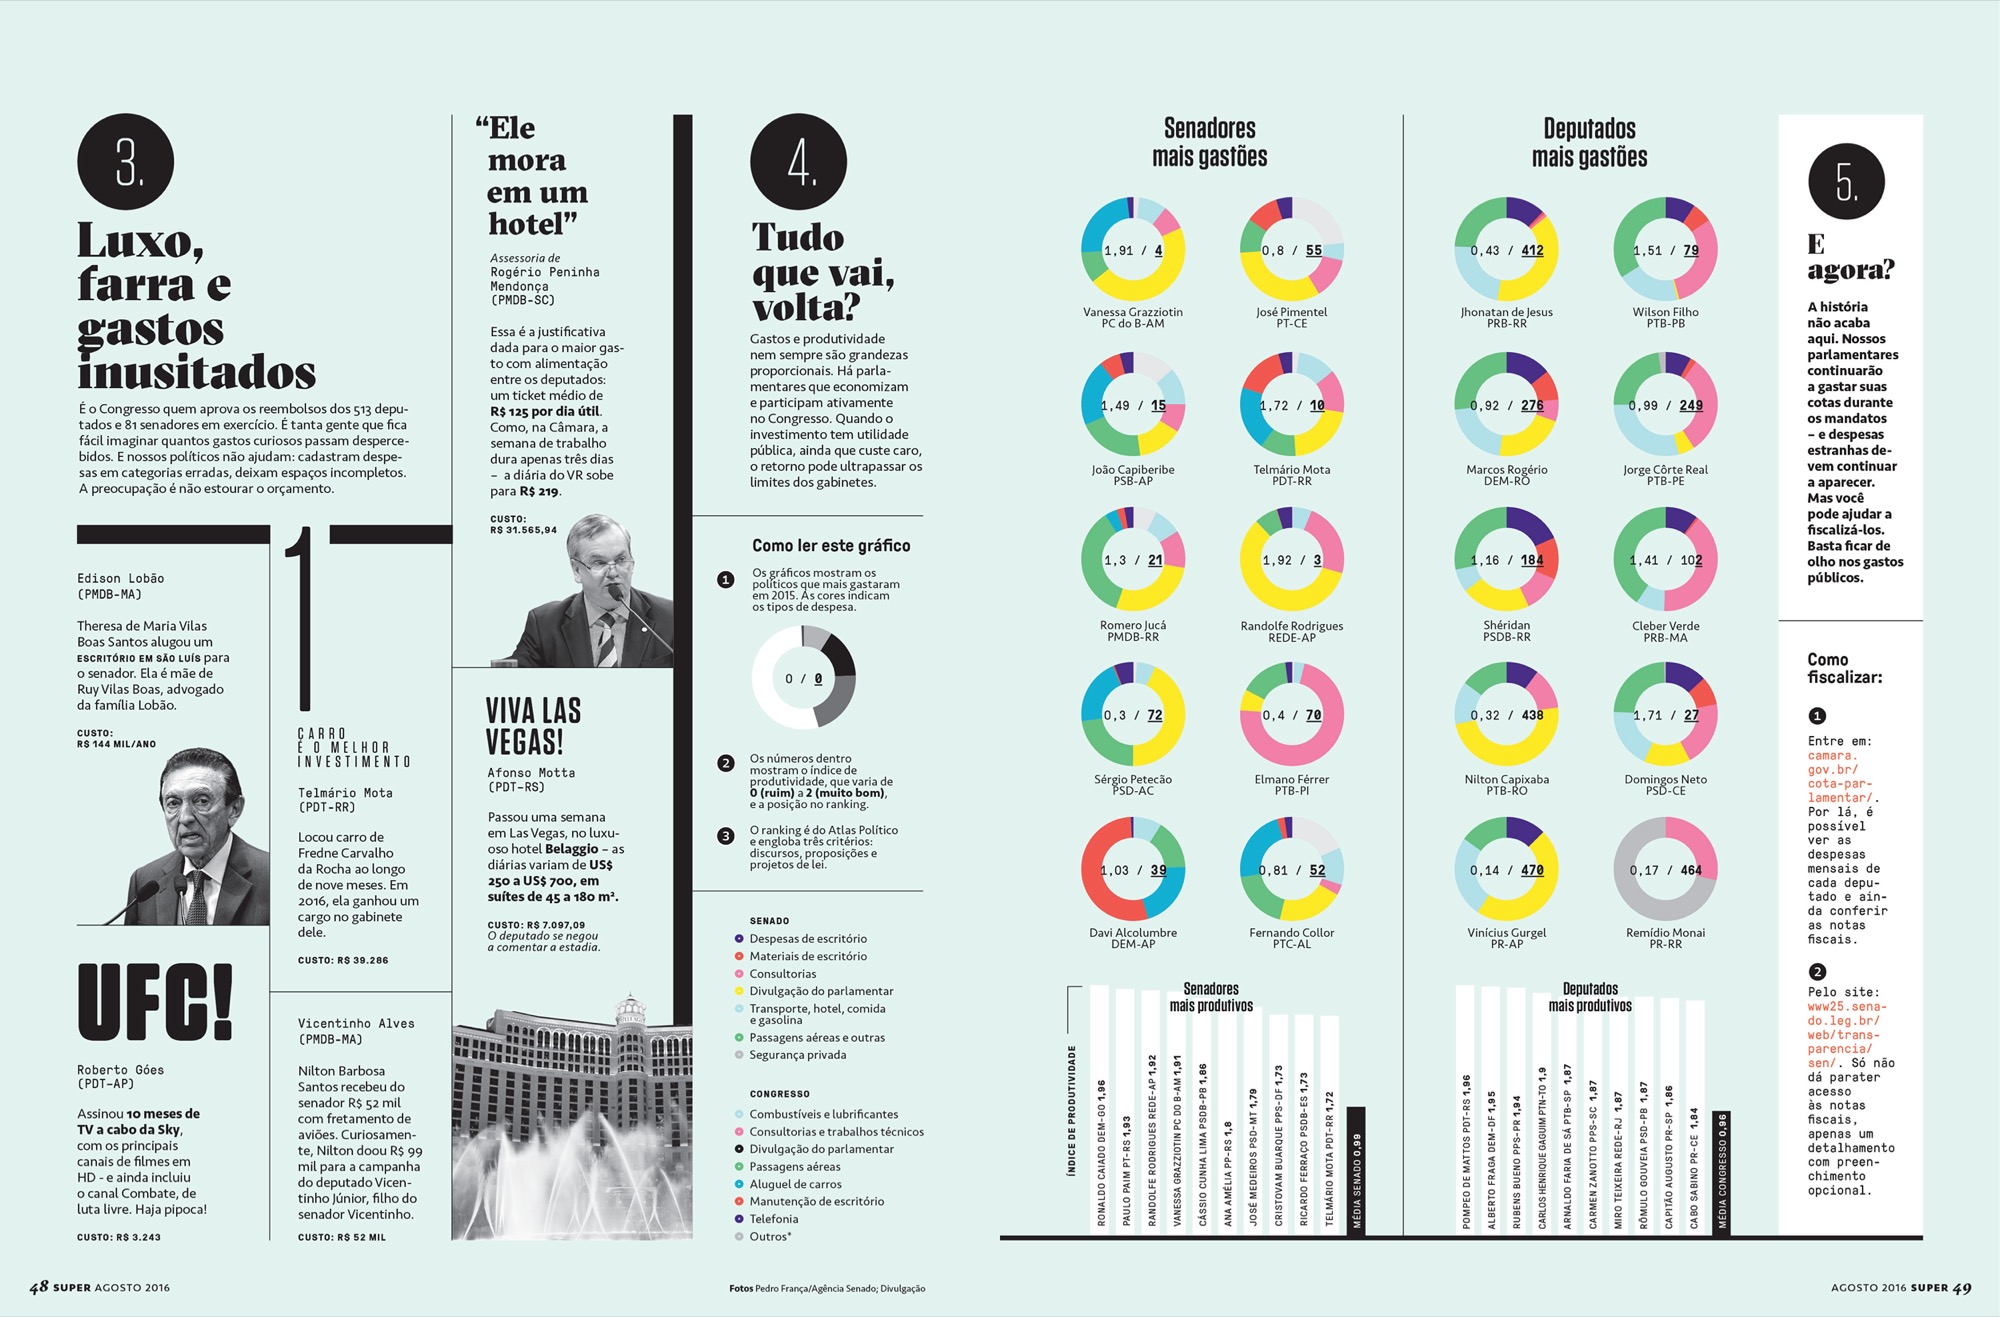
Dataviz spread through 6 pages on monthly expenses by the brazillian Senate and Congress. This database has more than 300 thousand lines and 26 columns. The data was analysed with pivot tables in Google Sheets and visualized with Tableau; the artwork was later cleaned up in Adobe Illustrator.
52nd SPD (Society of Publication Designers)
Merit winner – Infographic (data visualisation)
Art direction and infographics; Tableau