The Washington Post
I’ve been working with Washington Post’s Opinion visual team since September 2024, doing a bit of everything: graphics, design, art direction, coding, illustration. Here’s some of the work done so far.
George Will has written a column for The Washington Post since 1974, and in 2024 the Opinion section created several packages in celebration of 50 years.
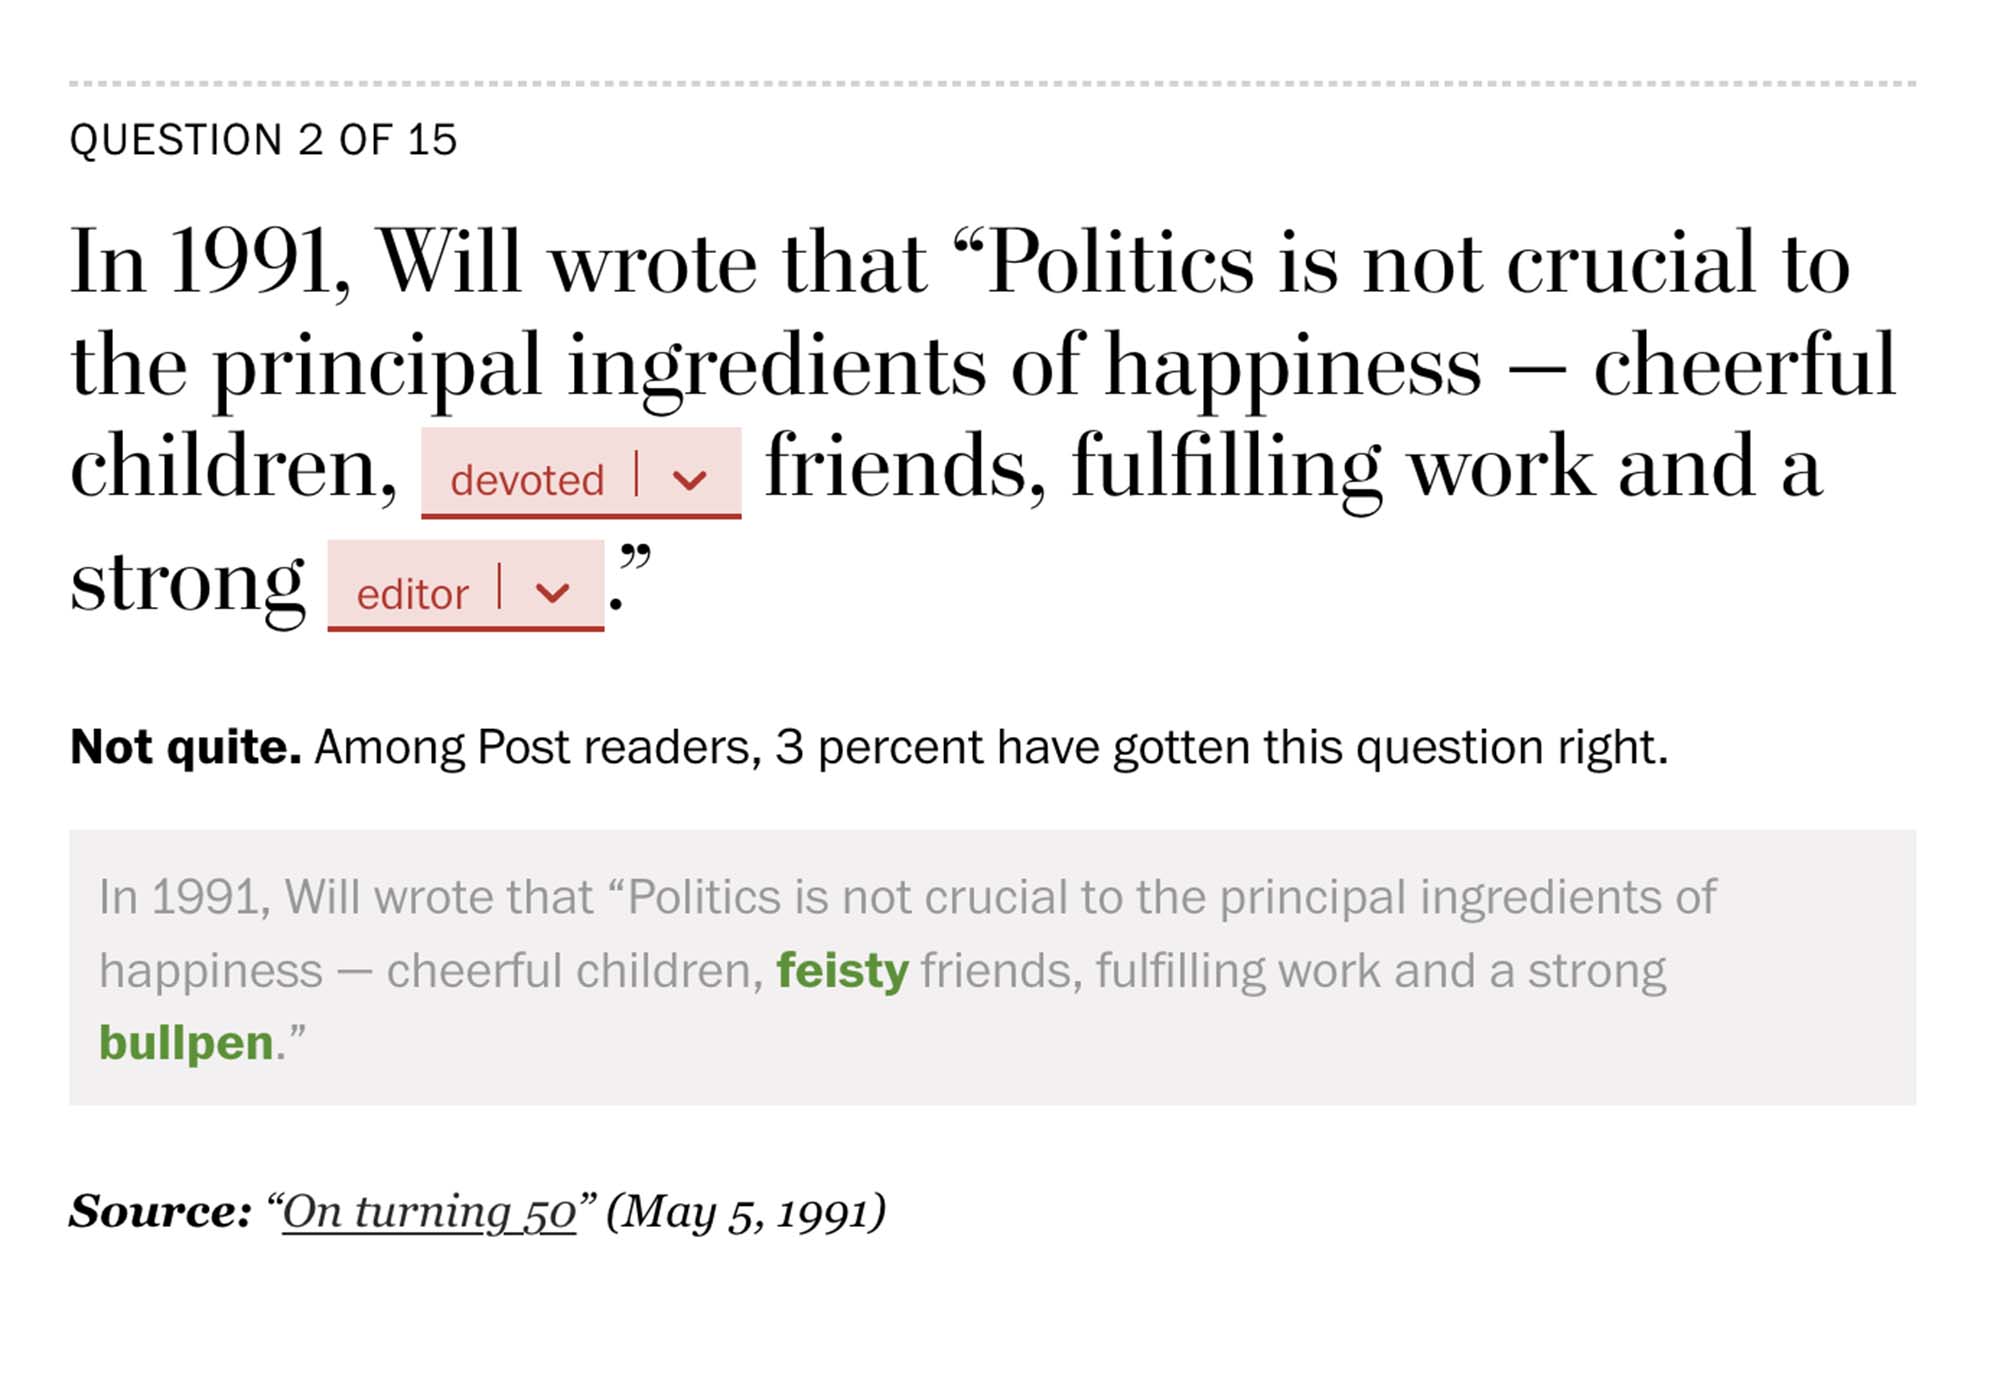
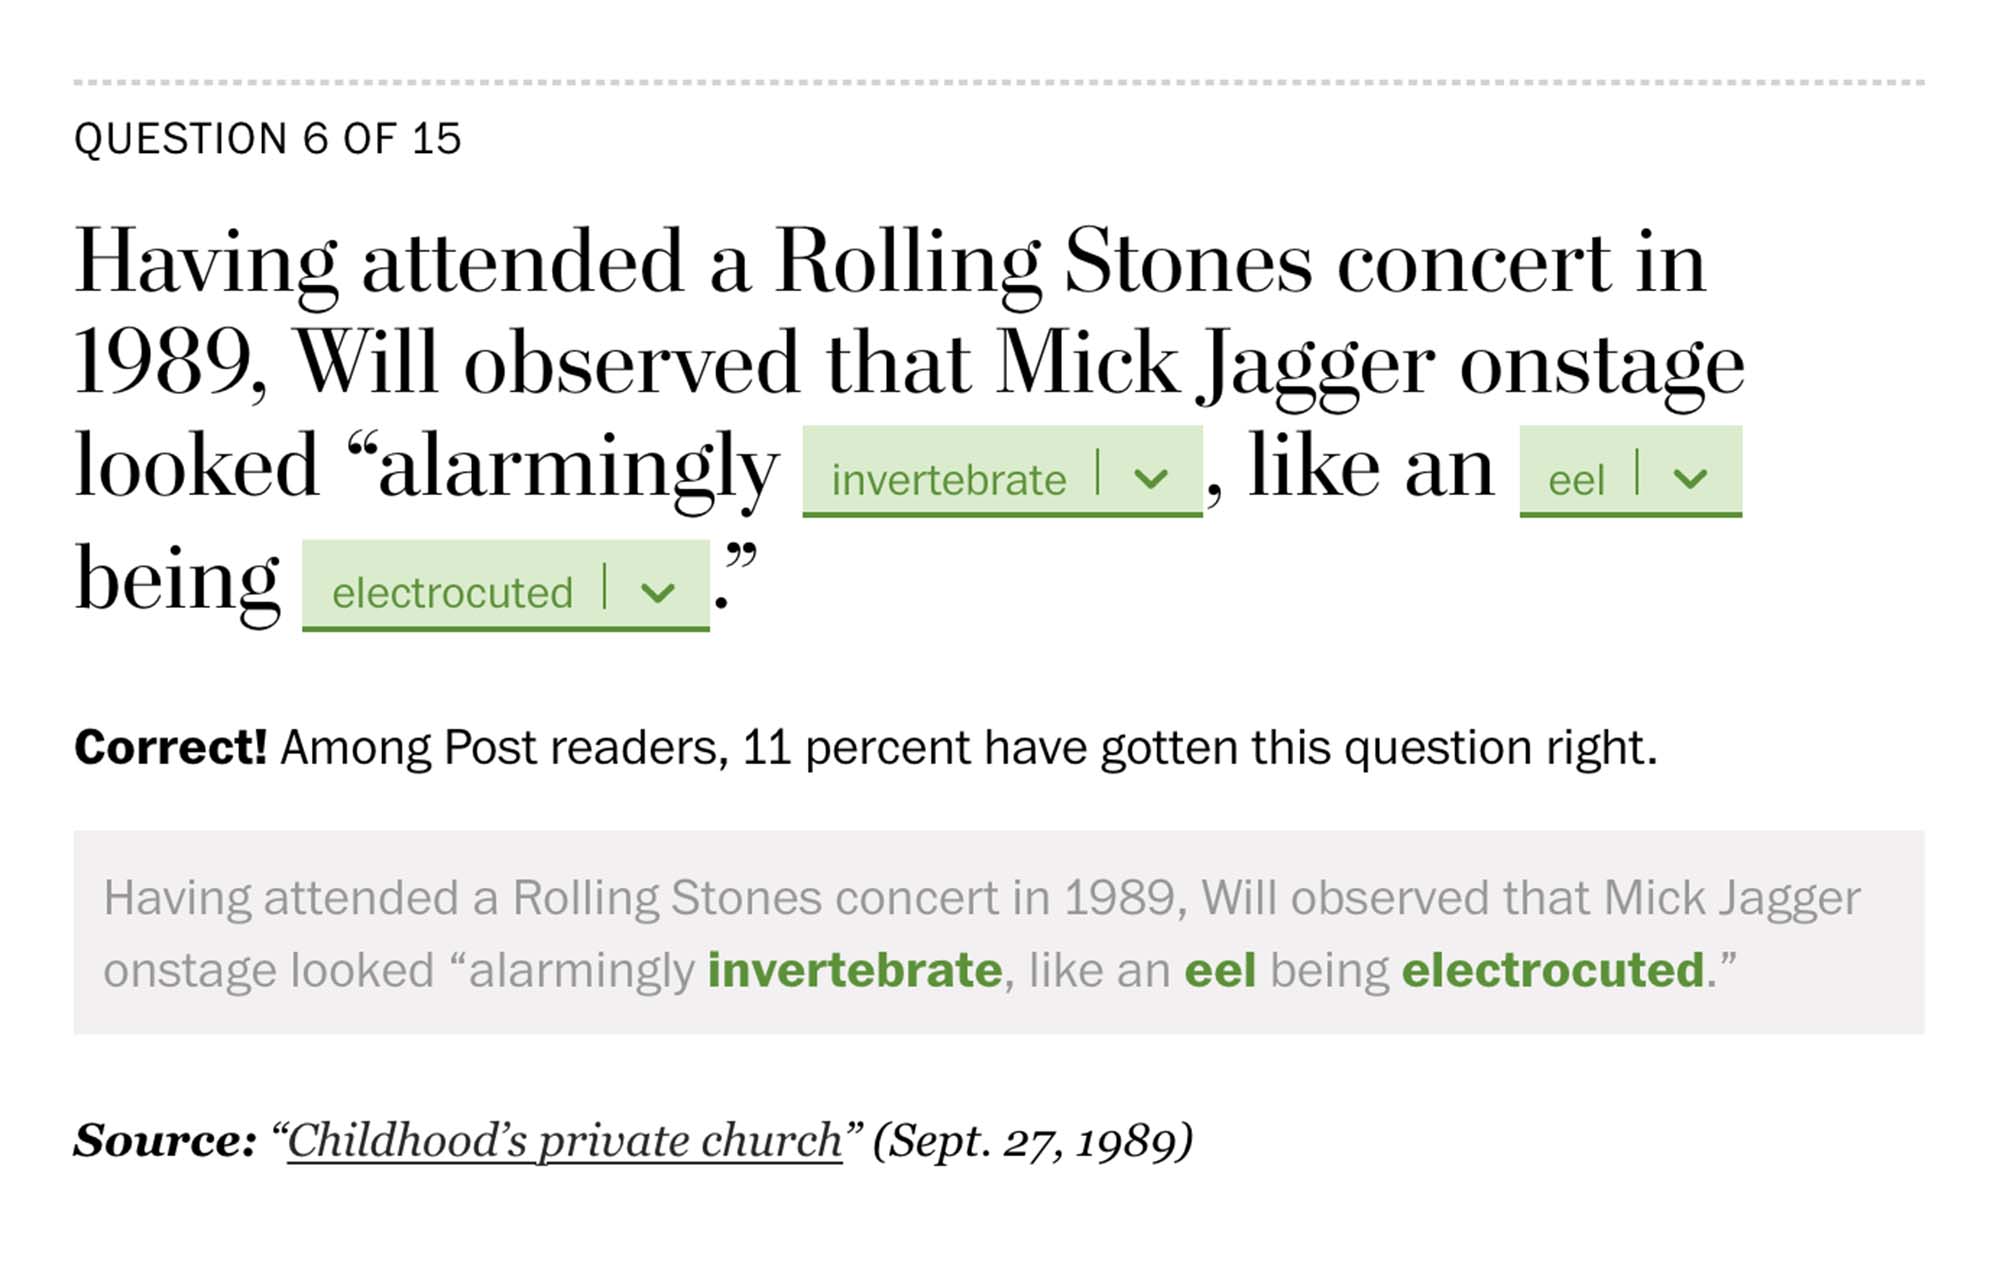
I worked on a quiz where readers were invited to guess words and sentences from some of his most famous quotes.
Working on top of the WaPo quiz template, I coded and designed some custom UI/UX components as madlibs/dropdowns inside some of the questions – I also created an animation on top of some of the quirkiest words used by Will on those quotes.
Done together with Chris Rukan and Amanda Shendruk.
Researchers recorded dogs on black backgrounds, and humans fail at finding their true emotions.


A fun piece - I created a animated collage of the star dog of the article, plus some scrollytelling pieces and a custom quiz for readers to guess as well the dog’s emotions. Coding, design and editing (with the help of Chiqui Esteban and Aaditi Lele).
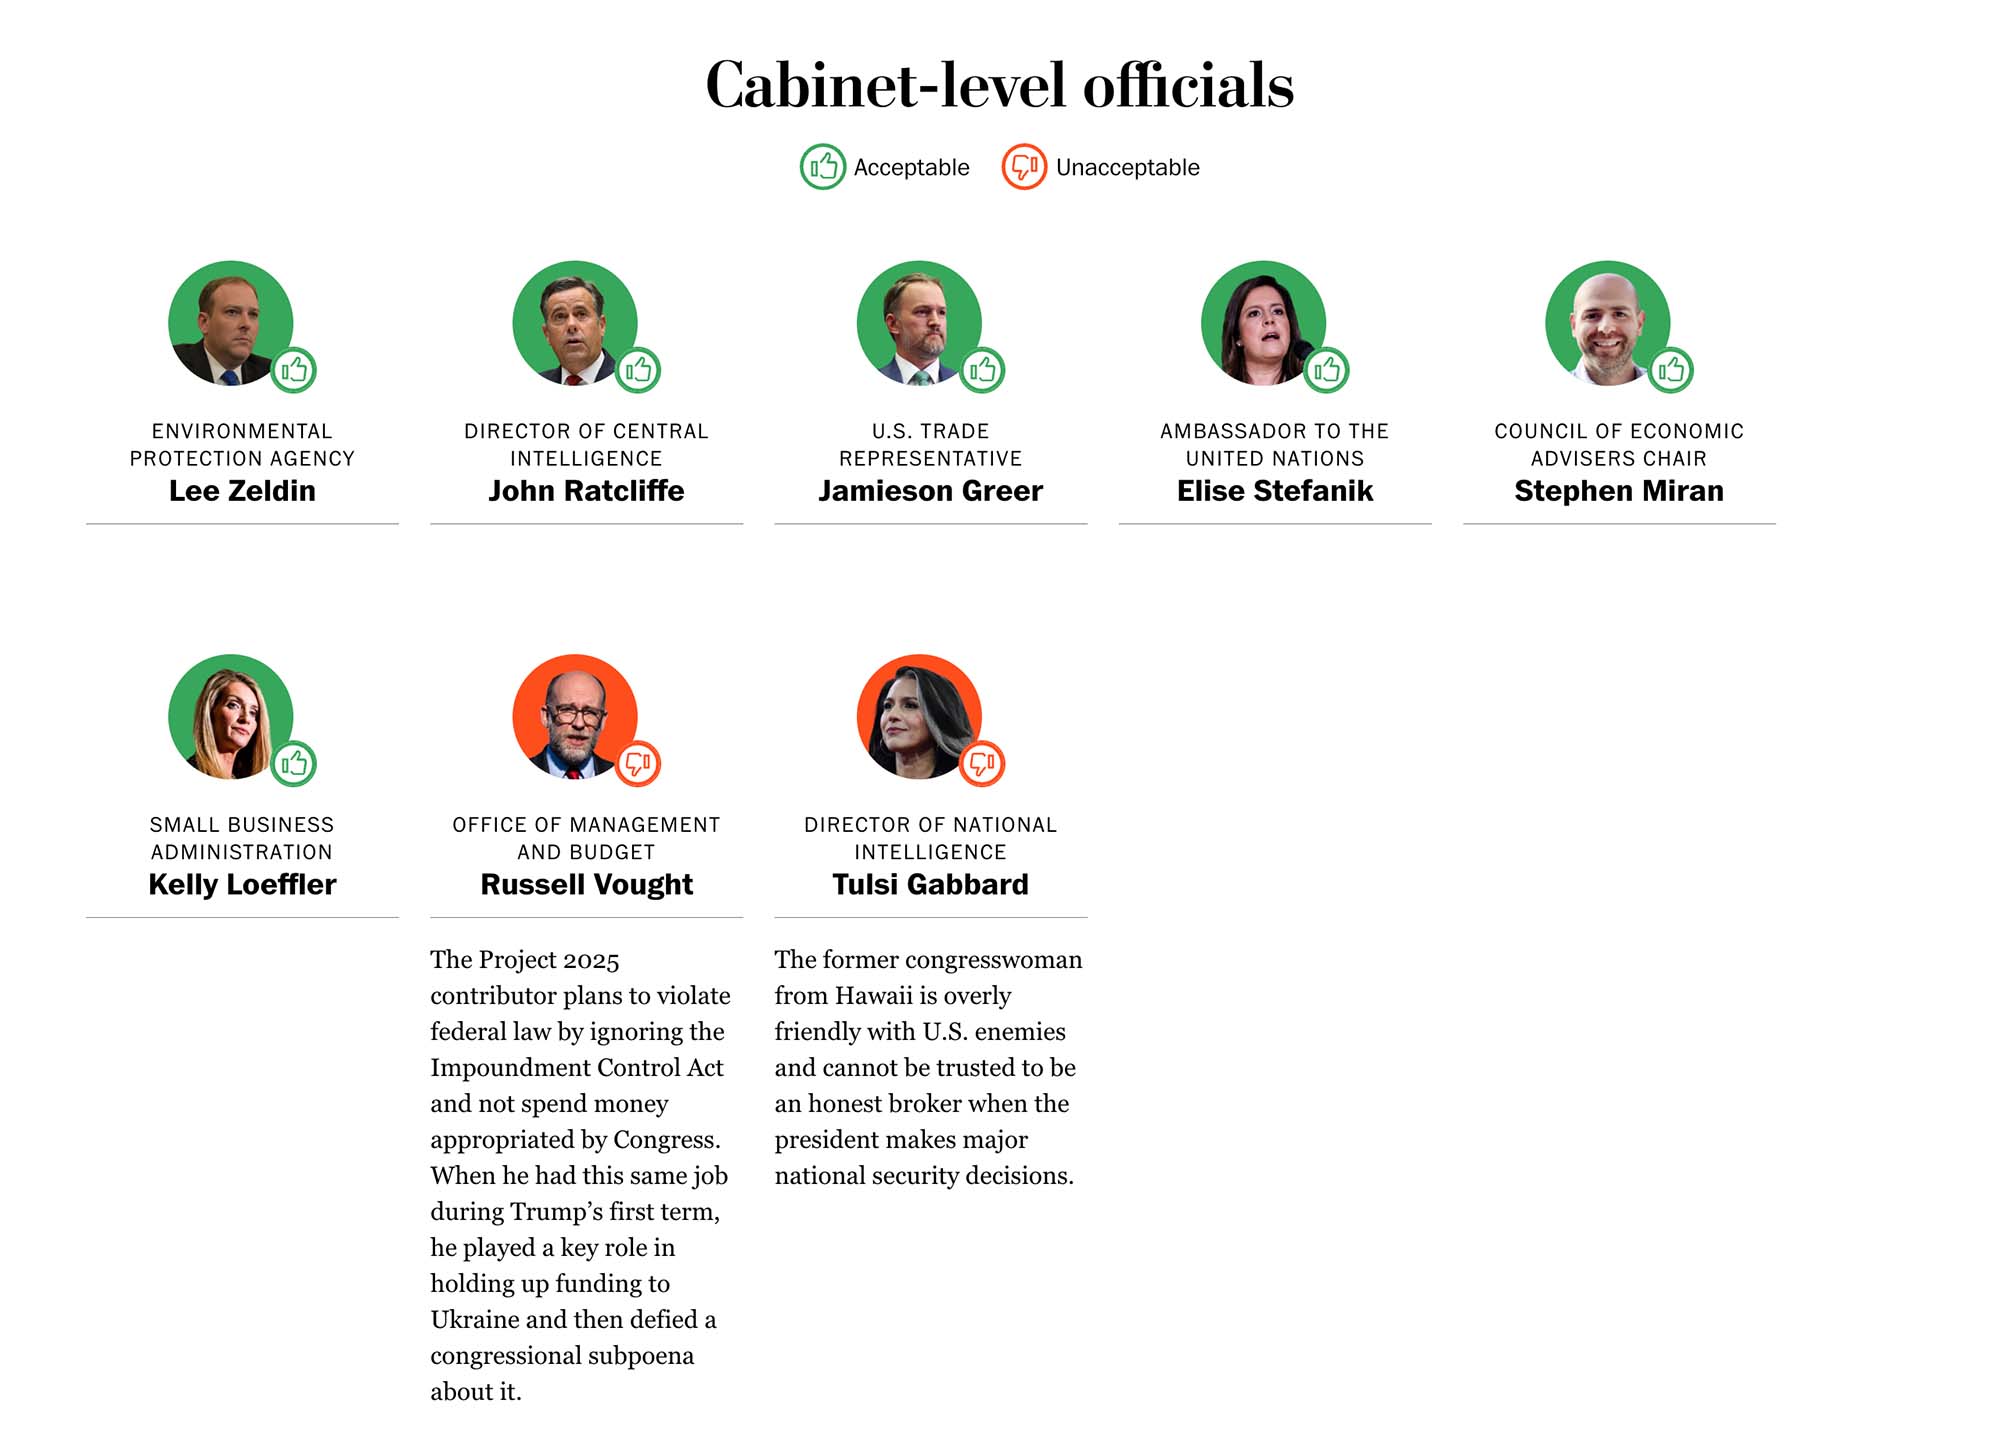
An editorial on who’s fit or who’s not fit as a cabinet pick in Trump 2.0. A quick turnaround – design and coding.

Carolina Miranda has a series of op-eds this year about the imagery of the Trump administration the second time.

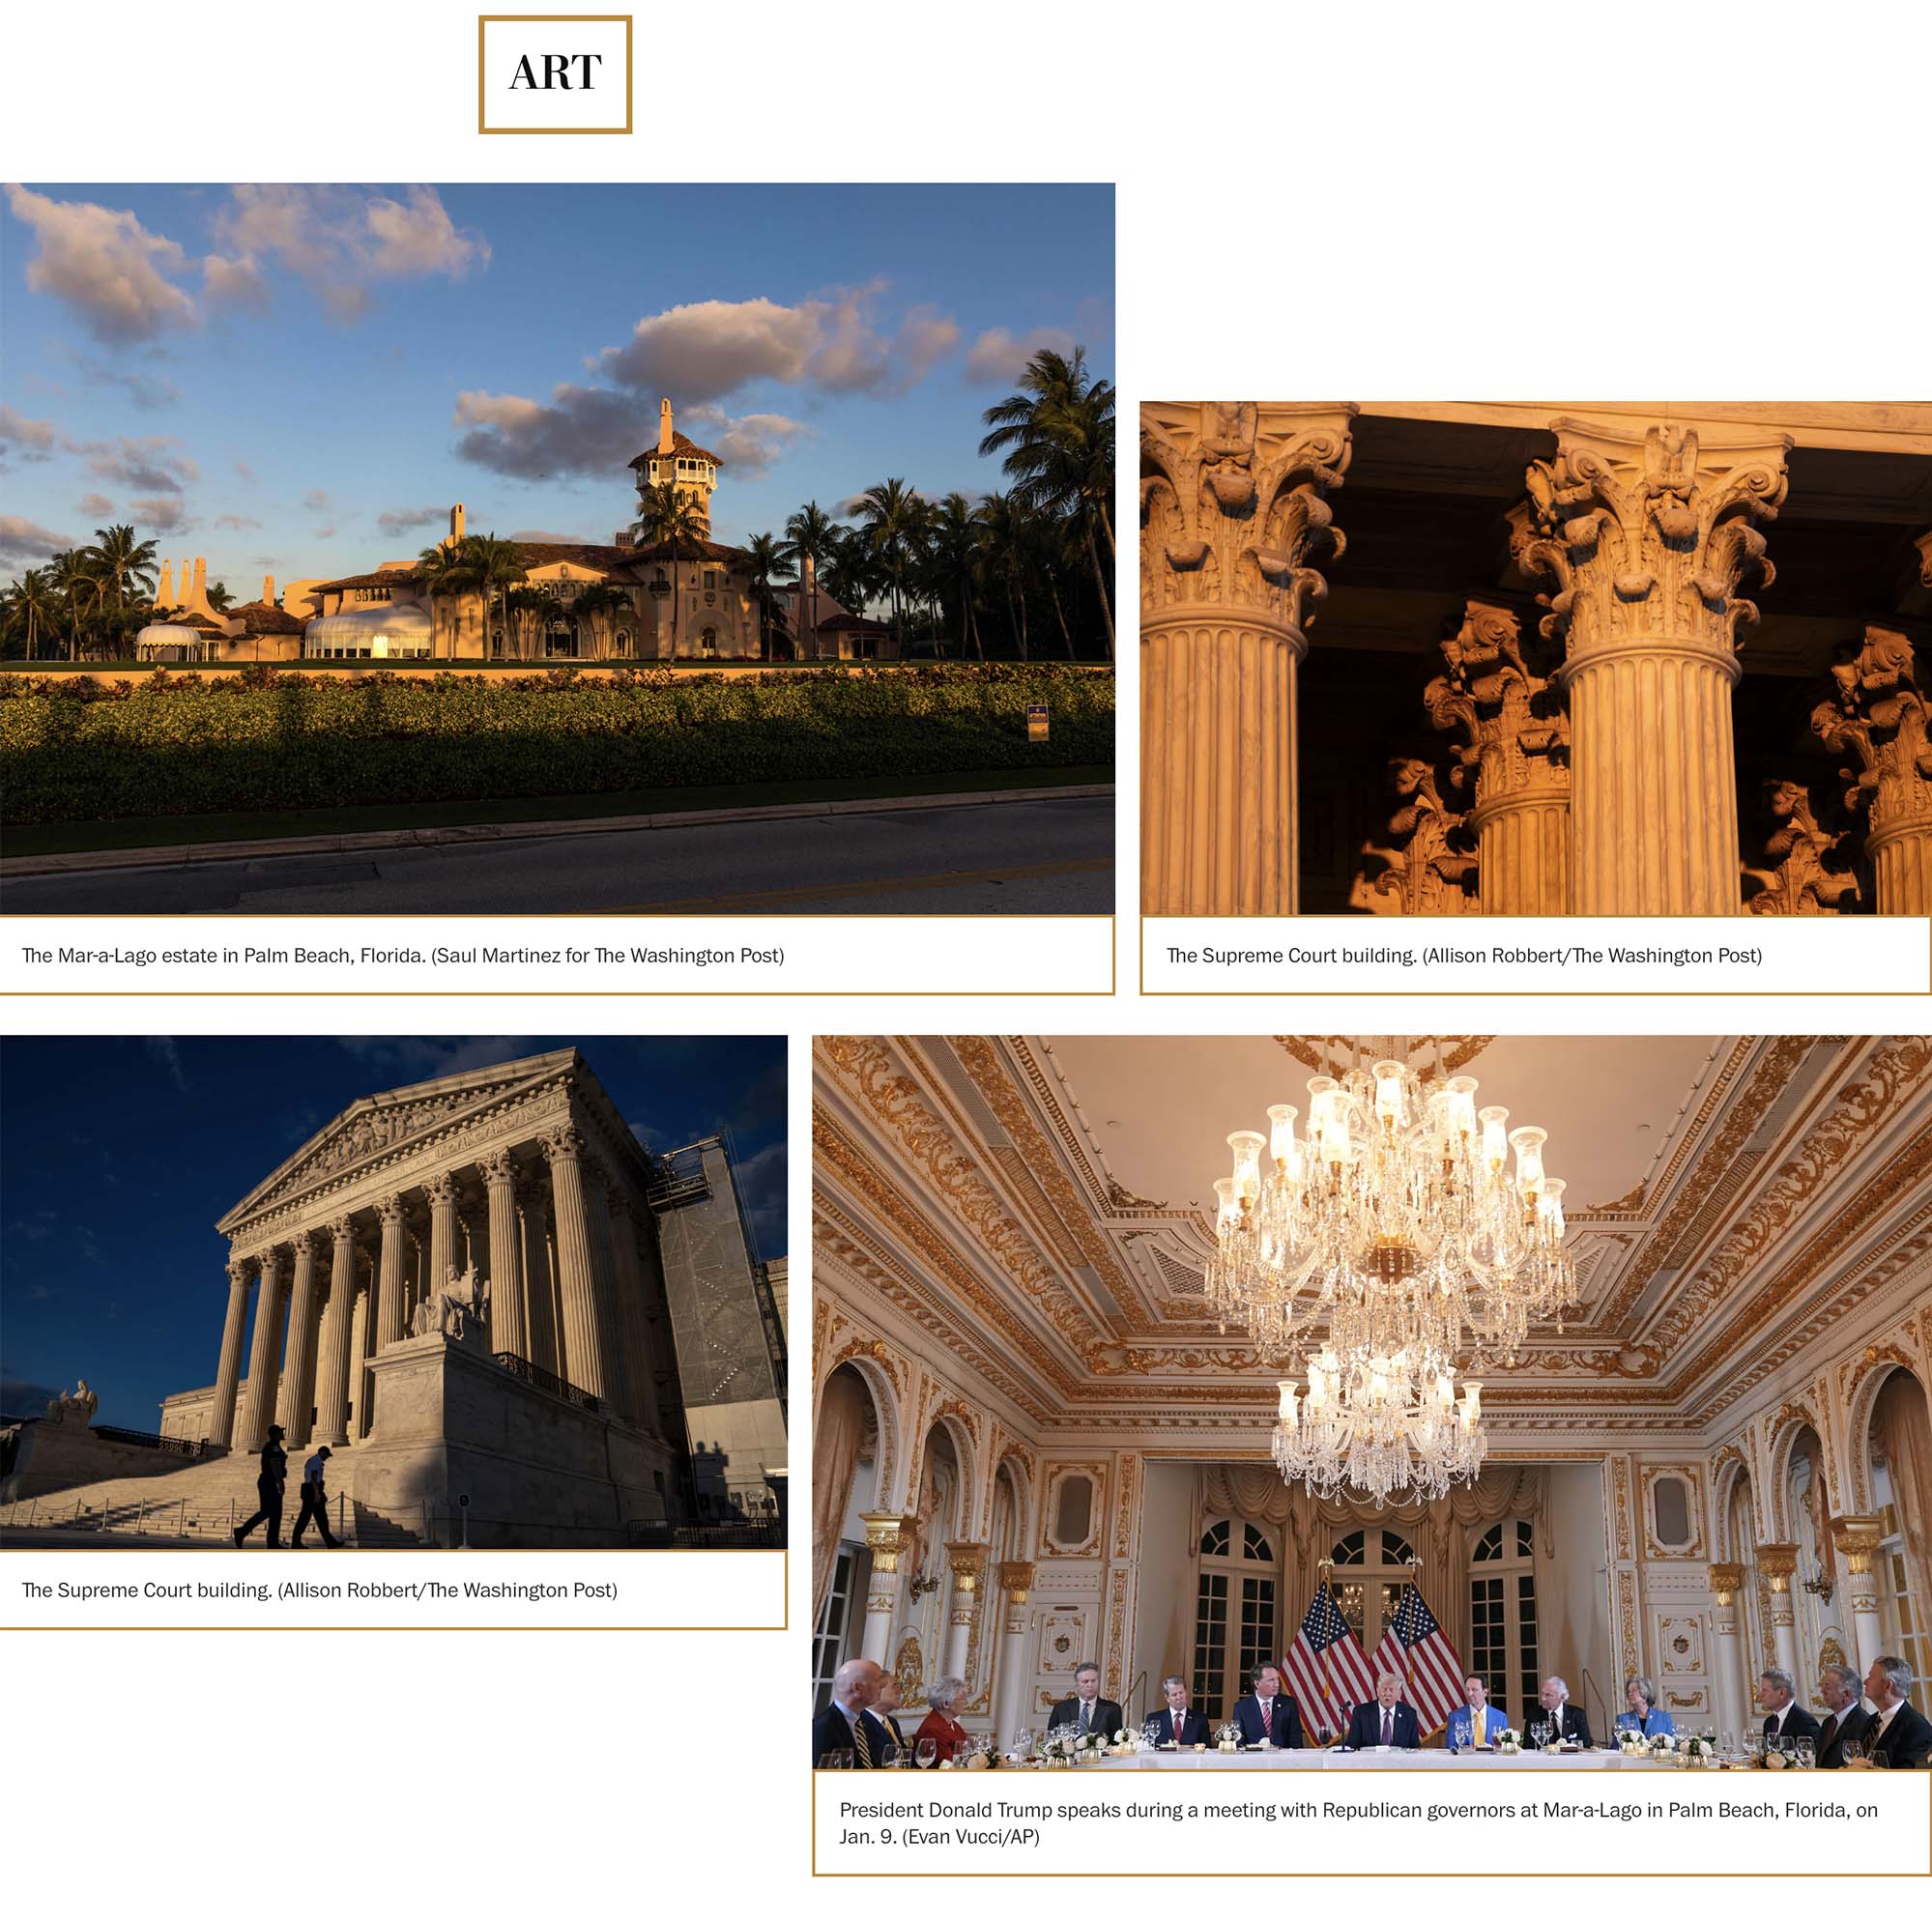

Together with Chloe Coleman (photo editing) and Chiqui Esteban (design and editing), we did this custom presentation, embracing the many faces and a sort of brazeness about the visual and cultural qualities of the 2nd Trump presidency.
Catherine Rampell, former columnist, and Amanda Shendruk, former visuals opinion journalist at The Washington Post, started collecting and gathering examples of data deletion and website purging done by the Trump administration at the beginning of 2025.
I helped with some of the data collection, and also worked on our digital presentation, by coding a simple grid component on top of the data.
An op-ed about how we really need to have rat counting as a tool for better planning on what to do with them.
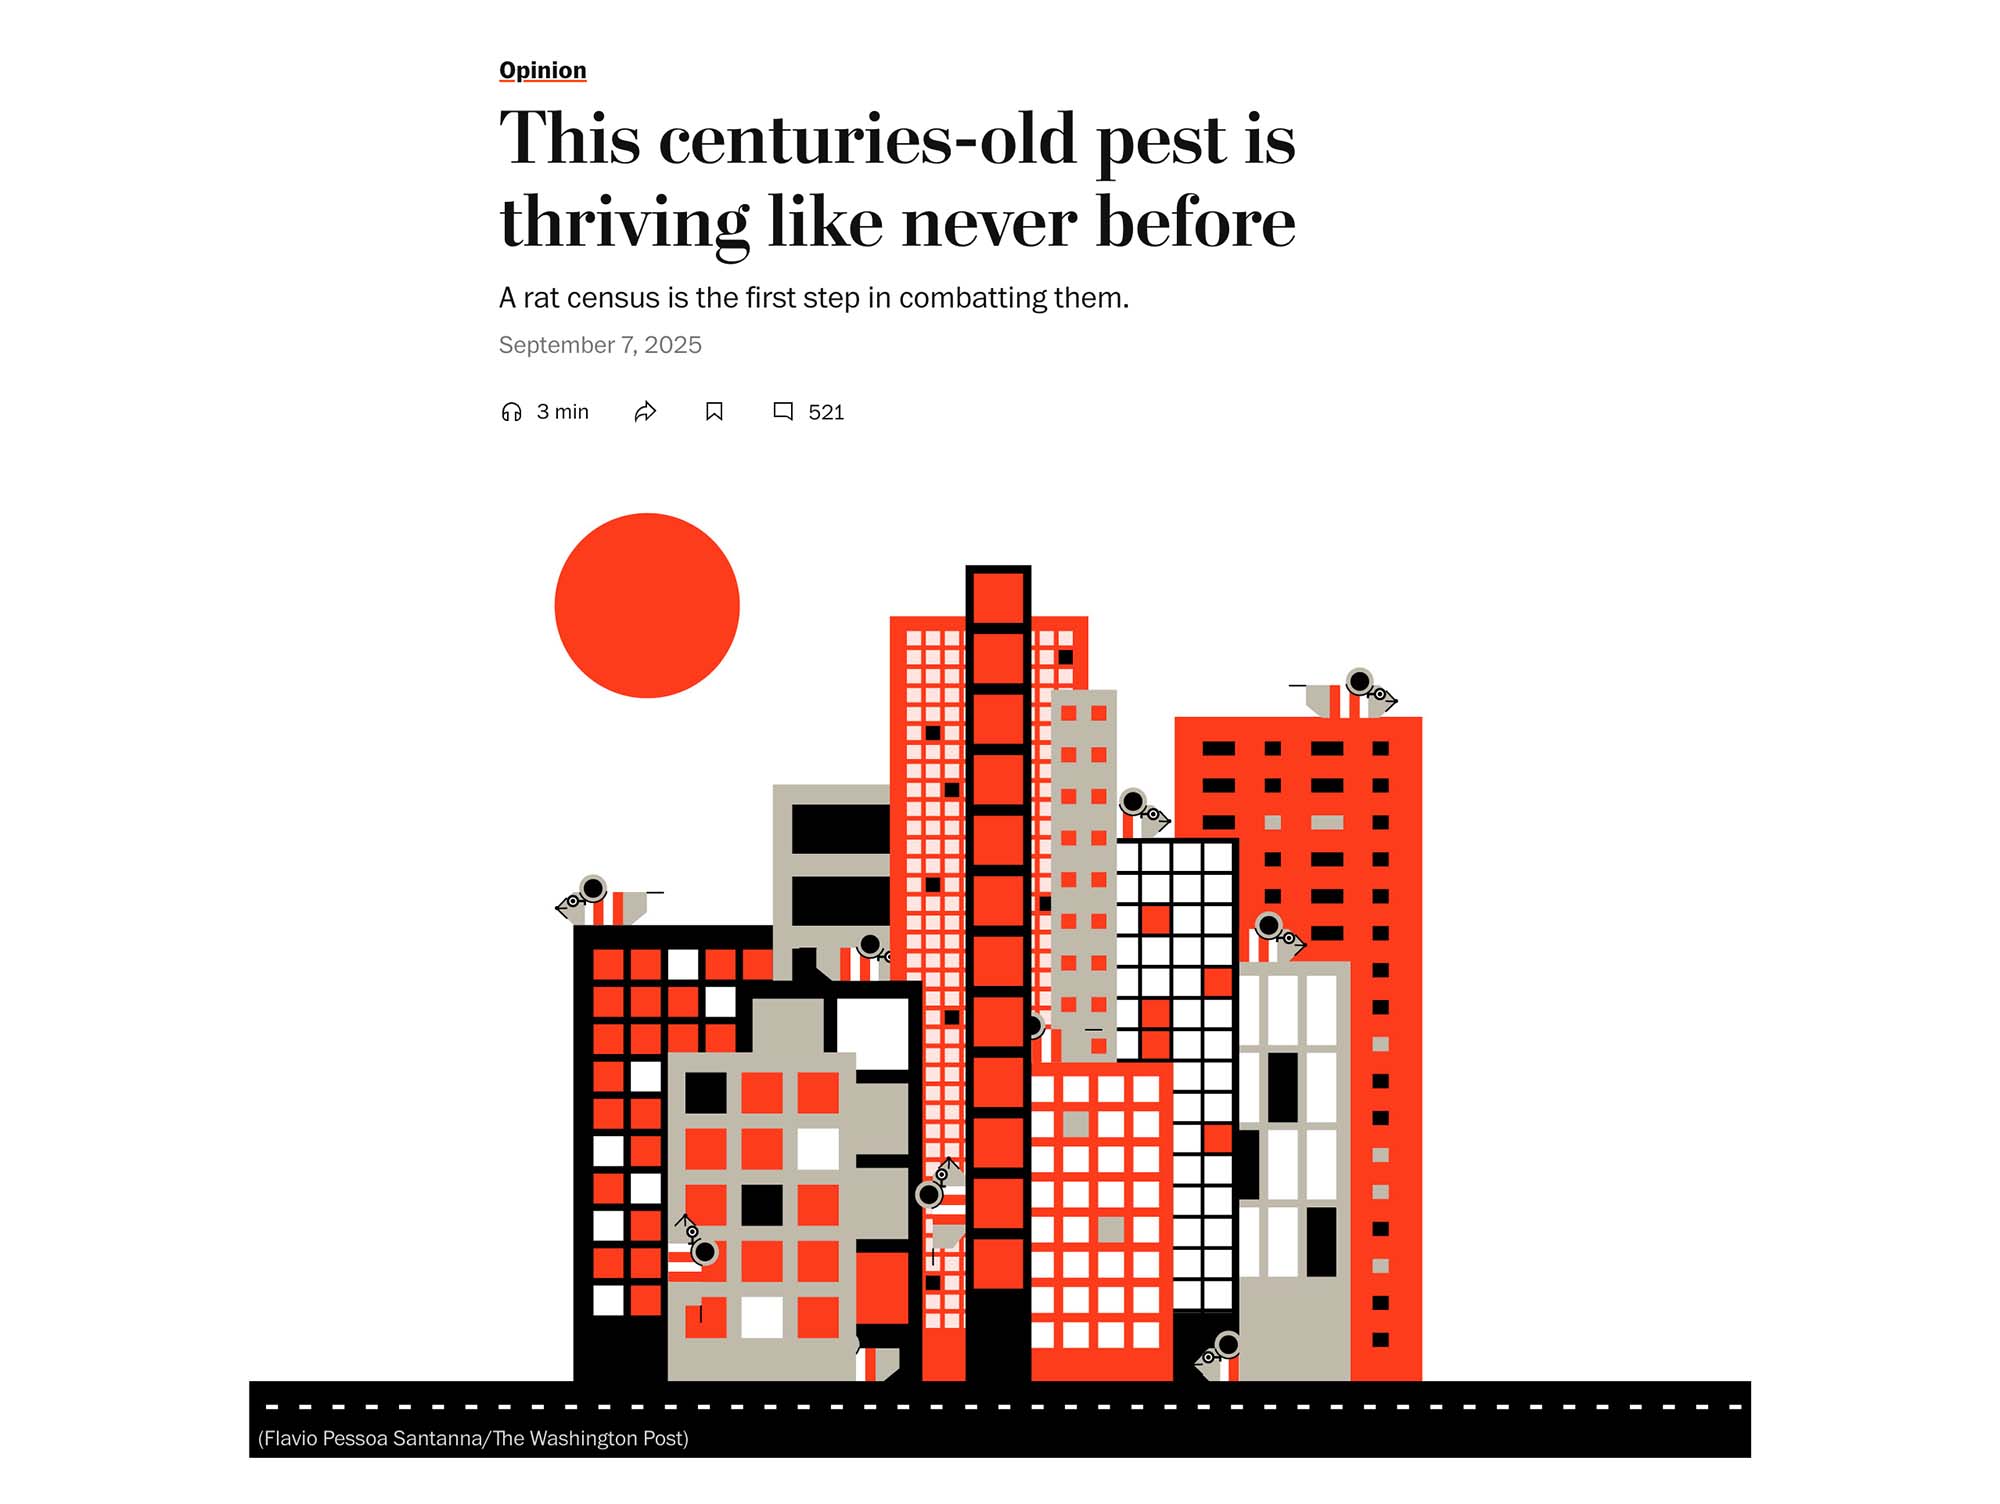

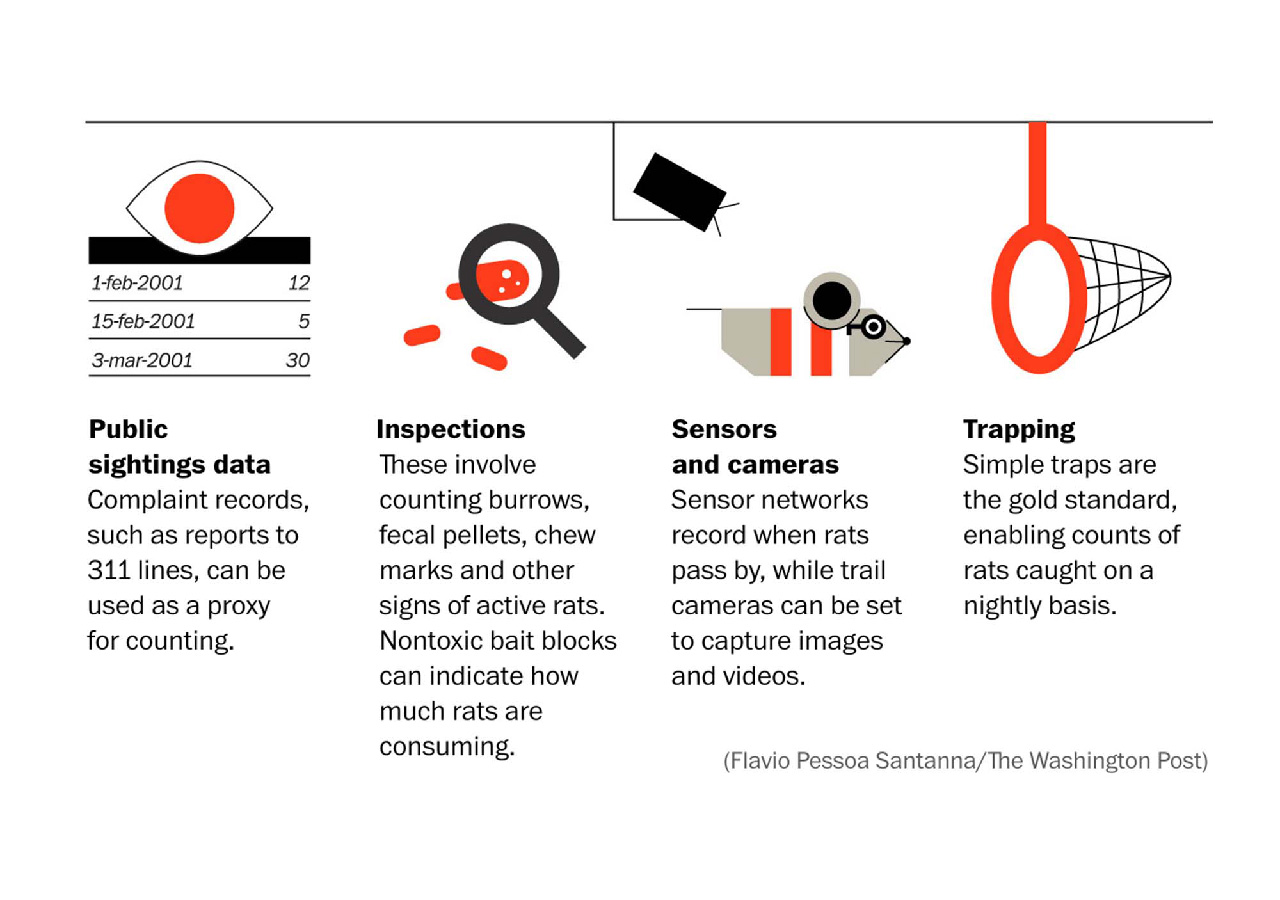
I did illustrations, charts and explainers for this – mix of Datawrapper, Adobe Illustrator and AI2HTML.